% Healthy Accounts
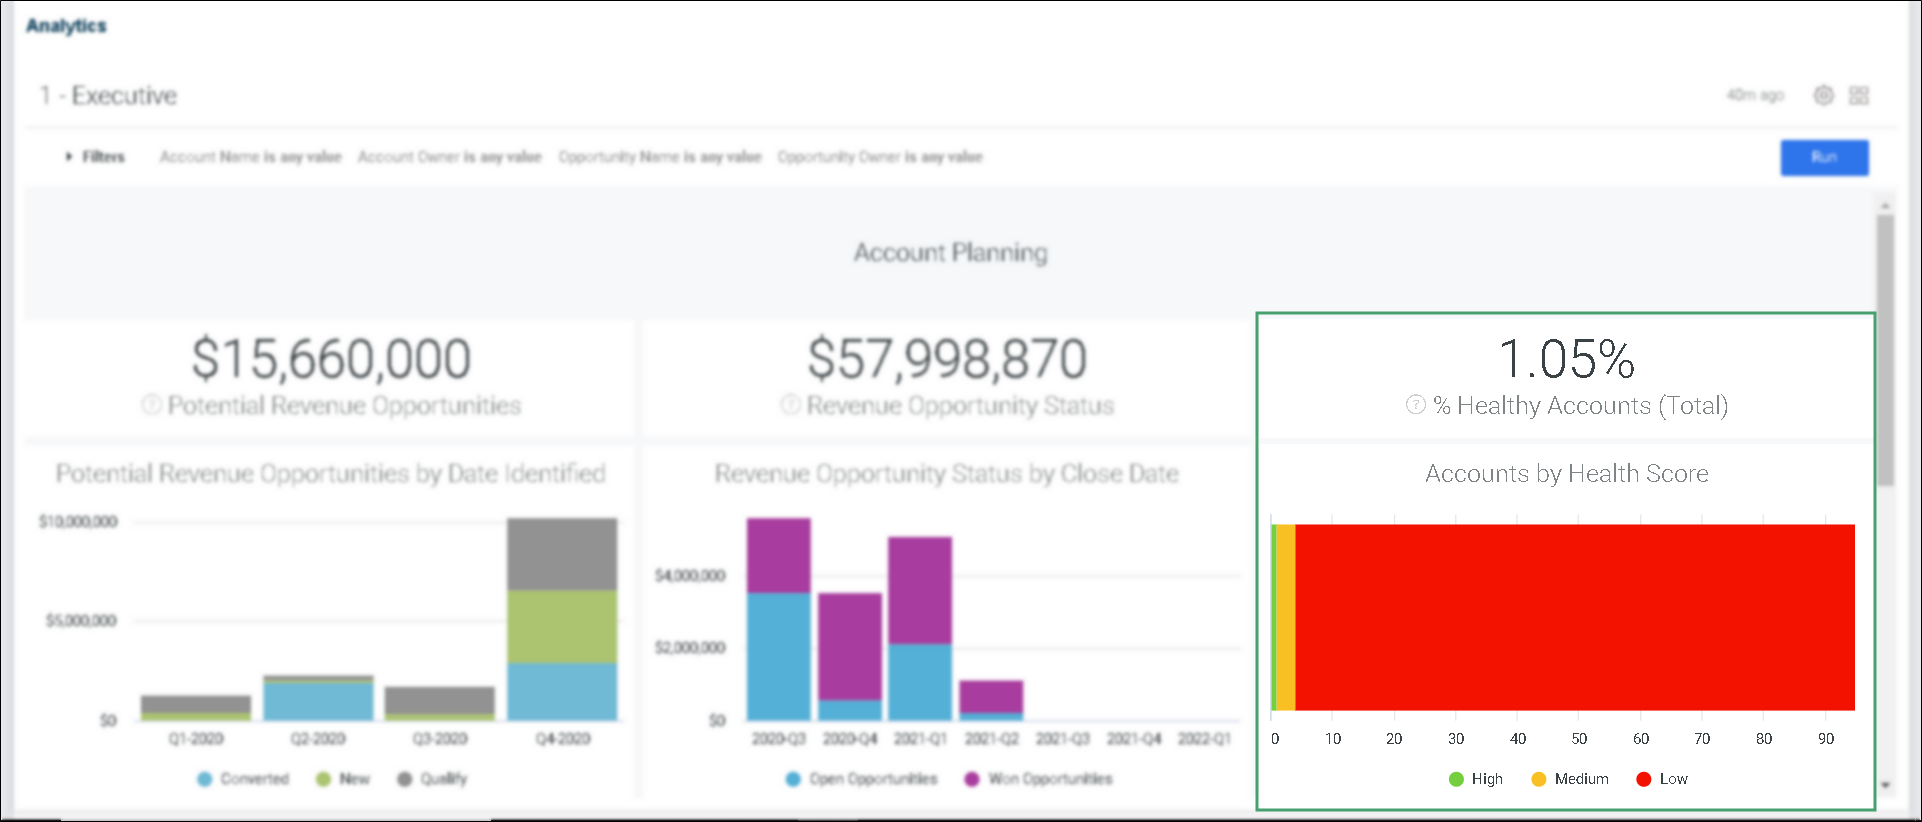
Purpose/Value
The % Healthy Accounts helps answer the following question:
-
What percentage of our key accounts will we be able to upsell/cross-sell?
The score for health is based on three separate factors in Revegy:
-
Customer Value - Typically tracked based on the grid or scorecard within the plan
-
Relationship Score - Tracked based on the Relationship Map (contacts and how contacts are managed)
-
Note: Map attributes like Organizational Level and Relationship Strength are scored and normalized on a scale of 100
-
-
Tasks - From the internal action plan (GOA)
Each factor has a score of 100 (they are aggregated to form the Health Score out of 100)
| High | ≥ 67 |
| Medium | between 34-66 |
| Low | ≤ 33 |
Blind Spots Addressed
-
Which accounts to focus on?
-
Why an account is not performing as expected?
Recommended Actions (Actionable Intelligence)
-
Drill down to a list of accounts sorted by Health Ratings.
-
From the results, drill down deeper by Revenue.
-
Based on your findings, determine where to focus your time and attention (i.e. where to inspect and coach).
KPI

-
Calculation = (# of active accounts where the health score ≥ 67) / # of total active accounts * 100
-
KPI = Percentage
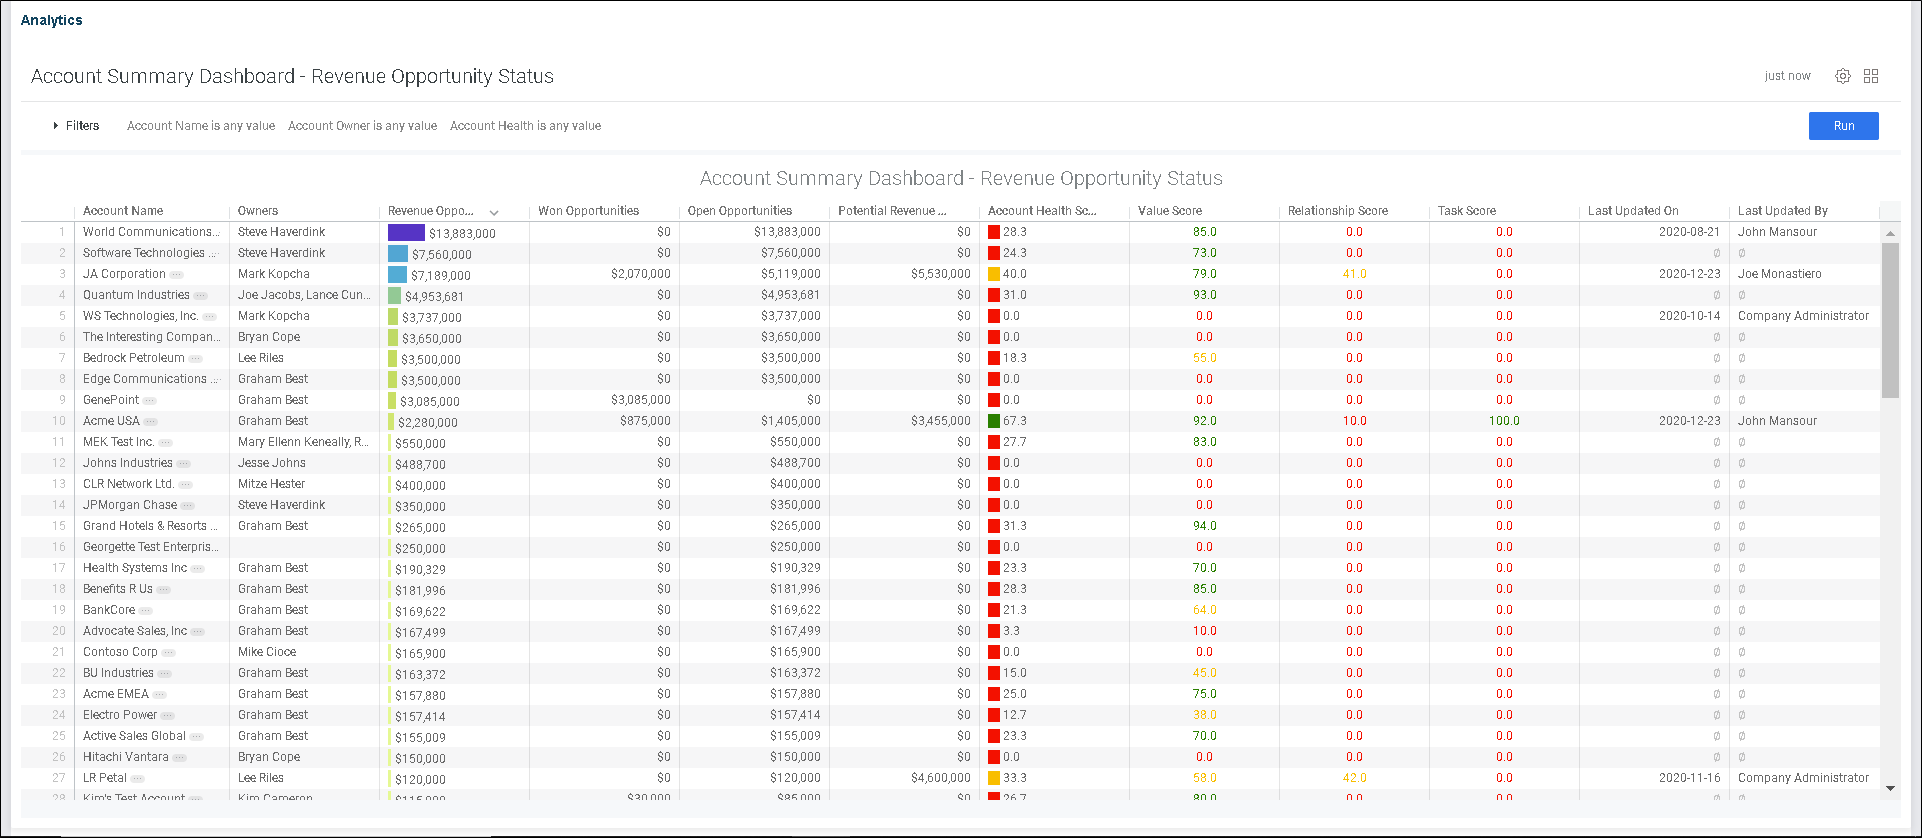
Recommended Actions (Actionable Intelligence)
Click on the KPI to open the Account Summary Dashboard – Revenue Opportunity Status table. The Account Summary Dashboard will reflect the filters applied on the Executive Dashboard.
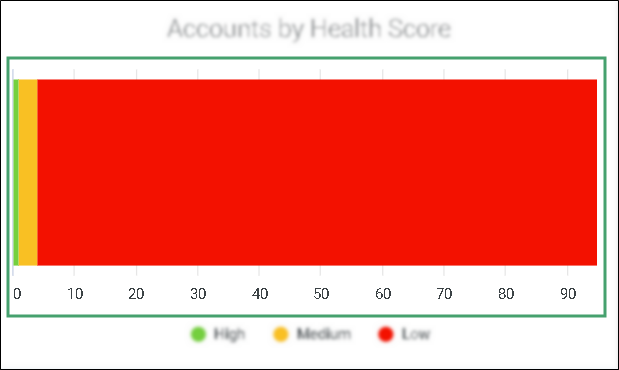
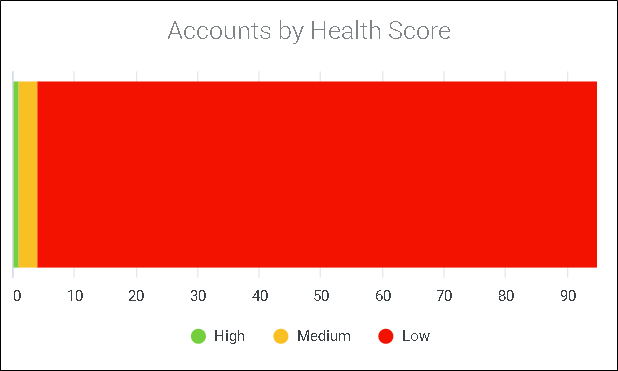
Chart
-
Data Source = Account Health Score
-
Health Score calculation = [Relationship Score (Score set up in map config)] + Task Score + [Value Score (Grid or Scorecard)] / 3
-
Task Score calculation =
0 If count (tasks) > 1 where CurrentDate - Max(Due Date) > 7 33 If count (tasks) > 1 where CurrentDate - Max(Due Date) ≤ 7 and ≥ 1 100 If count (objectives) > 1 where CurrentDate - Max(Due Date) <= 0
-
X-axis = Total active accounts
-
Bar is broken down by Health Score range:
Green 
≥ 67 Amber 
between 34 and 66 Red 
≤ 33
-
Legend order = High (green), Medium (orange), Low (red)
Purpose/Value
The % Healthy Accounts chart helps answer the following question:
-
How many accounts are not healthy and need immediate attention/coaching (those in red)?
Customer-Specific Variations
-
For customers not using Grid or Scorecard:
-
Health Score = (Relationship Score + Task Score) / 2
-
Recommended Actions (Actionable Intelligence)
Click on any bar to open the Account Summary Dashboard – Revenue Opportunity Status table.
-
Determine where to focus your time and attention (i.e. where to inspect and coach)