Potential Revenue Opportunities
Purpose/Value
This section is based on RGIs (if configured) or the potential revenue opportunities identified as part of the user's account planning program. This can be captured in Revegy (as RGI) or in the CRM (as early stage or potential opportunities).
The Potential Revenue Opportunities helps answer the following questions:
-
Are we identifying enough revenue in our key accounts to achieve our goals?
-
How much revenue is the account planning program creating? Is the program successful?
Definition/Description
-
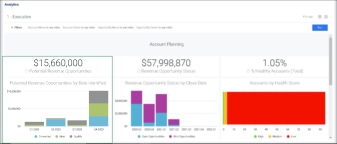
Potential Revenue Opportunities in Revegy Plan
-
RGI or MCT where potential revenue is tracked
KPI
Purpose/Value
The Potential Revenue Opportunities KPI helps answer the following questions:
-
Are we identifying enough revenue in our key accounts to achieve our goals?
-
How much revenue is the account planning program creating?
-
Is the program successful?
Blind Spots Addressed
-
Are we identifying enough cross-sell / up-sell ideas to support revenue goals?
Recommended Actions (Actionable Intelligence)
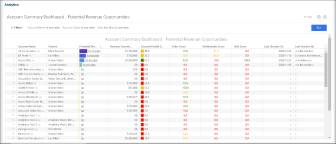
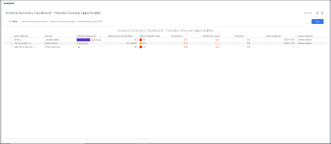
Click on the KPI to open the Account Summary Dashboard – Potential Revenue Opportunities table. The Account Summary Dashboard will reflect the filters applied on the Executive Dashboard.
-
Identify which accounts are productive
-
Identify which accounts are not productive but should be based on their total potential (where Whitespace analysis is being used)
-
Based on the foregoing, determine which accounts need to be reviewed/coached
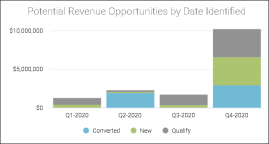
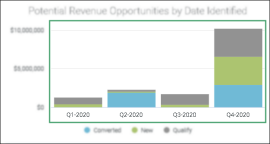
Chart
-
Data source = RGI
-
X-axis = Date RGI was created in Quarters (e.g. Q1-2020) for the Current Year (e.g. CY-1, CY-2)
-
Y-axis = Total RGI amount
-
Currency Type = Revegy Company currency
-
Bars are broken down by RGI status categories
Purpose/Value
The Potential Revenue Opportunities chart helps answer the following question:
-
What are the trends by quarter for revenue identified?
- What is the cadence for identifying revenue? Is it regular?
- Is enough revenue converted into opportunities to meet account planning or sales planning goals?
Customer-Specific Variations
-
Data source can be an MCT that shows 'Potential Opportunities'
-
Chart title can be renamed based on MCT's name
-
X-axis can be based on the 'Close Date' from the MCT
-
If based on the MCT 'Close Date', the time frame range will be CY, CY +1, CY + 2, etc. The bars will be broken down by 'Stage' or 'Status' in the MCT
-
Blind Spots Addressed
-
Why are we trending down (or up)?
Recommended Actions (Actionable Intelligence)
Click on any bar or any date to open the Account Summary Dashboard – Potential Revenue Opportunities table for that selected quarter.
-
Drill down to view a list of accounts with revenue by quarter
-
Locate the accounts trending down - those accounts should be reviewed/coached
