Revegy Managed Open Opportunities
Purpose/Value
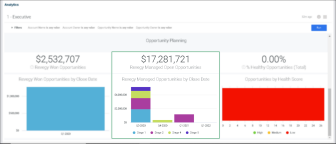
The Revegy Managed Open Opportunities shows the following:
-
Focused on all other opportunities not closed/won
-
How much revenue are we managing with our opportunity planning program?
KPI
-
KPI = Total of all open opportunities
-
Data source =Open opportunities managed in Revegy (where status is not closed/won or closed/lost)
-
Currency = Revegy Company currency
Recommended Actions (Actionable Intelligence)
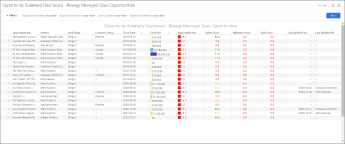
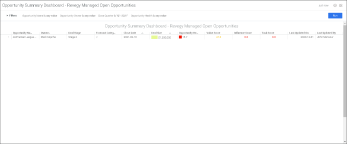
Click on the KPI to open the Opportunity Summary Dashboard - Revegy Managed Open Opportunities table. The Opportunity Summary Dashboard will reflect the filters applied on the Executive Dashboard.
Chart
-
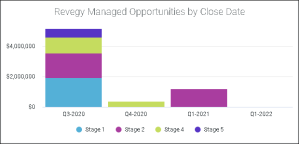
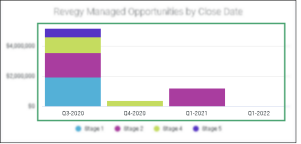
Chart = Opportunities broken down by their estimated close quarter
-
Data source = Open Opportunities managed in Revegy
-
X-axis = Expected Close Date created in Quarters (e.g. Q1-2020) within the Current Year and beyond (CY, CY+1, CY+2, etc.)
-
Y-axis = Total open opportunities amount
-
Currency = Revegy Company currency
-
Bars = Broken down by Opportunity Stage
-
Legend = Displays Opportunity Stage in the same order as in Revegy application
Purpose/Value
-
Do I have a steady flow of key opportunities across quarters?
-
In what stages are the opportunities?
-
It helps sales leaders and frontline managers to identify where the team needs to focus
Blind Spots Addressed
-
Do we have any early stage opportunities scheduled to be closed in the next quarter or so?
-
Is the Estimated Close Date realistic when compared to the progress being made?
-
Where are the risks?
Recommended Actions (Actionable Intelligence)
Click on any bar to open the Opportunity Summary Dashboard - Revegy Managed Open Opportunities table for that quarter.
